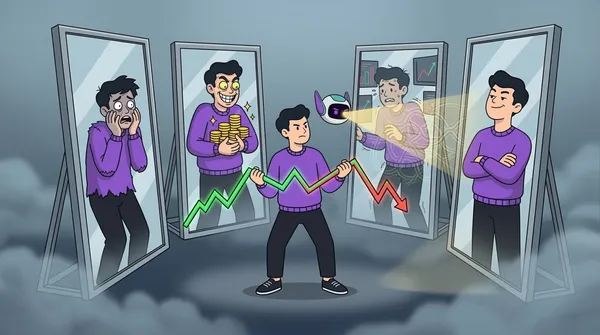
You have a trading journal. It is a spreadsheet. You update it — sometimes. You know roughly what your win rate is. You have a vague sense that you trade better in the mornings. But you cannot tell whether last Tuesday’s losing streak was caused by market conditions, a flawed setup, or the fact that you were frustrated after a family argument and never should have opened your platform at all.
This is the ceiling of spreadsheet-based trade tracking. You can record what happened. You cannot explain why.
The Spreadsheet Trap: Why Most Traders Stay Stuck
Spreadsheet journaling is better than no journaling. But it has four structural problems that prevent most traders from getting real value out of it.
1. Manual Entry Kills the Habit
Every time you close a trade, you have a choice: switch to your spreadsheet and enter the data manually, or get on with your day. For most traders, the friction of manual entry gradually erodes the habit. You skip one trade because it was small. Then two. Within a month, the spreadsheet has gaps everywhere and the data is not trustworthy.
A journal you update intermittently is not a journal — it is a record of the trades you remembered to write down. Those tend to be your winners.
2. Spreadsheets Track Outcomes, Not Behaviour
A spreadsheet answers: What happened? It cannot answer: Why did I take that trade? What was I feeling? Did I follow my rules?
Trading psychology research consistently shows that the biggest differentiator between profitable and unprofitable retail traders is not strategy selection — it is execution consistency. And execution consistency is driven by psychological factors that a column of numbers cannot capture.
Your spreadsheet will never tell you that you enter losing trades at a 3:1 rate on days when you first check your news feed before opening your platform. Plancana can.
3. Analysis Requires Hours You Do Not Have
Building meaningful analysis from a spreadsheet requires advanced Excel or Python skills. Want to know your performance by time of day? By market session? By emotional state? Each insight requires building a formula, a pivot table, or a chart from scratch.
Most traders never build those tools, so they never get those insights. They look at their running P&L and call that analysis.
4. Psychological Tracking Is Simply Not Possible
The most important trading variable — your emotional state — has no column in a spreadsheet. There is no formula for frustration. No function that flags that you entered your last five trades in a state of post-loss desperation.
Without a psychological record, you are running a business without tracking its most volatile cost input. You will never understand your performance fully, and you will repeat the same emotional mistakes indefinitely.
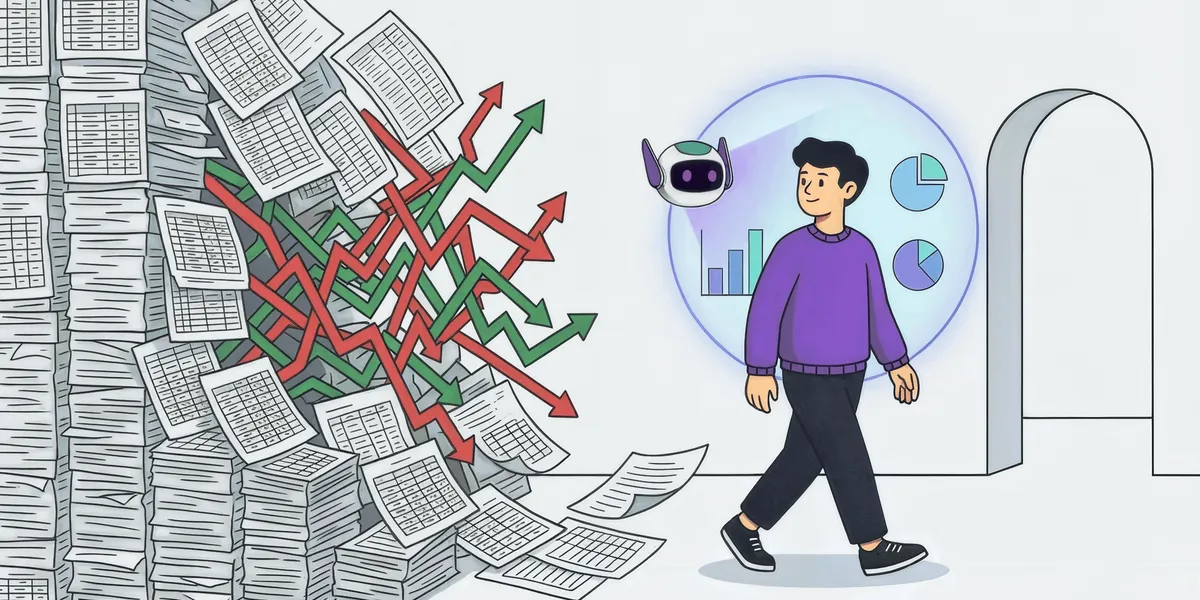
What a Modern Trading Journal App Actually Does
A dedicated trading psychology app like Plancana is built around a different question than a spreadsheet. Not “what happened?” but “why did it happen — and how do I change it?”
Automatic Trade Sync: Eliminate the Friction
Plancana connects directly to MetaTrader 4, MetaTrader 5, ByBit, and TradeLocker. Your trades are imported automatically as soon as they close. No manual entry, no gaps, no selective memory.
This is the single biggest practical advantage over spreadsheets. When journaling requires zero effort to start, traders actually do it consistently. Consistency is what turns a journal from a document into a dataset.
Pre-Trade and Post-Trade Mood Diary
Before every trade, Plancana prompts you to log how you are feeling — a quick emotional check-in that takes five seconds. After the trade closes, you log again.
Over time, this creates a parallel dataset: trade outcomes correlated with emotional states. The AI then surfaces the patterns. You might discover that your win rate is 58% when you log “calm” or “focused” before a trade — and drops to 31% when you log “anxious” or “frustrated.” That data point alone is worth more than any indicator.
AI-Powered Insights Without the Work
Plancana’s AI analyses your combined trade and psychology data and delivers plain-language insights in your performance dashboard. You do not need to build a pivot table. You do not need to know statistics. You get insights like:
- “Your largest losing trades tend to occur after 3 consecutive wins — possible overconfidence pattern”
- “You take twice as long to exit losing positions as winning ones — classic loss aversion”
- “Your best performance is between 08:00–11:00 GMT; afternoon sessions produce 40% more rule violations”
These are the insights that change behaviour.
Performance Dashboards That Actually Surface Patterns
Plancana’s visual analytics break down your performance by instrument, session, day of week, setup type, and emotional state — without you building a single formula. Trends that would take hours to identify manually become immediately visible.
A single glance at your heatmap might reveal that you are consistently profitable on EUR/USD in the London session and consistently losing on GBP/JPY in the New York overlap. That is an actionable insight from a dashboard that built itself.
Risk Management Tools Built In
Plancana’s position sizing calculator and risk manager are integrated into the journaling flow. Before each trade, you can calculate your optimal position size based on your account risk percentage and the distance to your stop-loss. This prevents the overlevering that typically accompanies emotional trading mistakes.
Spreadsheet vs. Plancana: A Direct Comparison
| Feature | Spreadsheet | Plancana | | -------------------------- | ------------------------------- | ----------------------------------- | | Trade data entry | Manual — you fill it in | Automatic via broker sync | | Emotional state tracking | Not possible | Pre-trade and post-trade mood diary | | AI pattern analysis | Not available | Built-in, automatic | | Performance breakdowns | Requires building formulas | Pre-built visual dashboards | | Psychology-P&L correlation | Not possible | Core feature | | Risk calculation | Manual formula | Built-in calculator | | Habit formation | High friction, low compliance | Low friction, high compliance | | Mobile access | Limited (mobile Excel is poor) | Native iOS & Android app | | Setup time | Hours to build a useful version | Minutes |
How to Transition from Spreadsheet to Plancana
If you have been using a spreadsheet and want to move to Plancana without losing historical context:
- Export your spreadsheet data. Keep it as a reference for your pre-Plancana performance baseline.
- Download Plancana — free on App Store and Google Play.
- Connect your broker. MetaTrader 4/5, ByBit, and TradeLocker all connect in minutes.
- Start the mood diary from day one. Every trade, every session, no exceptions. The psychological data only becomes valuable when it is consistent.
- Do your first AI insight review after two weeks. By then you will have enough data to see the first patterns emerge.
Why Psychology-First Tracking Produces Better Results
The reason dedicated apps outperform spreadsheets is not primarily technical — it is psychological. When journaling is frictionless, you do it. When you do it consistently, you build a real dataset. When you have a real dataset, patterns emerge. When patterns emerge, you can change behaviour. When behaviour changes, performance improves.
A spreadsheet makes journaling hard. It also strips out the psychological dimension that explains most of what actually drives your results. Plancana is designed to remove both of those obstacles simultaneously.
If your goal is to understand why you win and lose — not just how often — a dedicated trading psychology app is not an upgrade to your spreadsheet. It is a fundamentally different tool, built for the question that actually matters.
Download Plancana free on iOS or Android and start building the journal that shows you what the spreadsheet never could.